
Do Gut Bacteria Affect Your Weight? The Microbiome

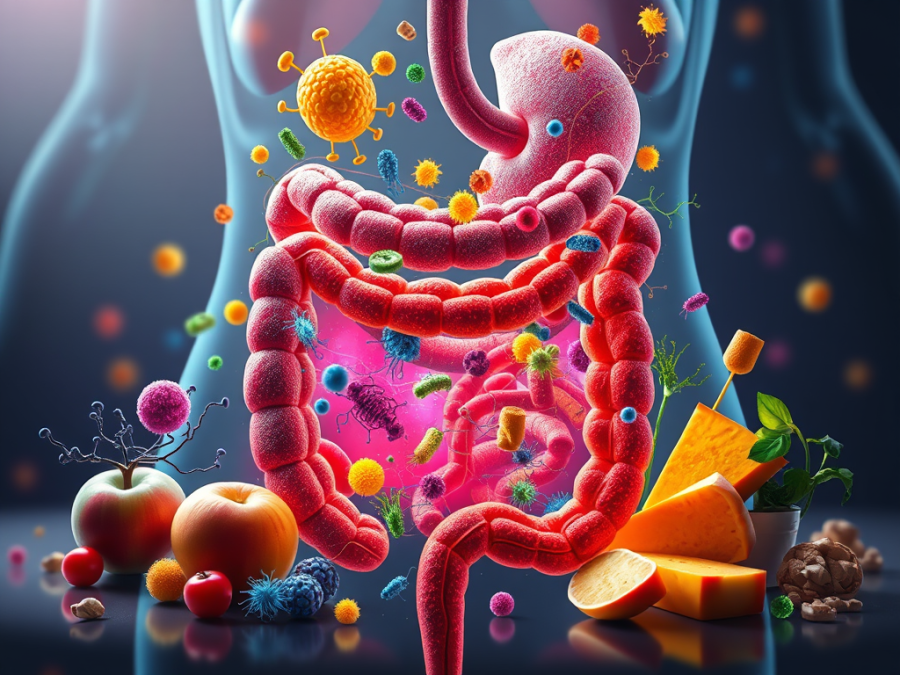
When we talk about obesity, the conversation usually stops at calories and exercise. The trillions of microorganisms living in the gut deserve a place in it too. That ecosystem shapes metabolism, appetite, immune function, and the way the body handles stress. I have found that once patients understand the connection, they see weight and health in a very different light.

The microbiome covers more than bacteria. It includes archaea, fungi, viruses, and all their genetic material and metabolic products. The microbiota refers to the organisms themselves. None of it is passive. These organisms interact with diet, hormones, and the immune system in ways that either support health or push toward disease.

Diet does most of the shaping. Patterns rich in fiber and plant foods foster diversity and encourage species like Bifidobacteria and Bacteroides. Diets heavy in fat and low in fiber do the reverse. In older adults, that second pattern has been linked to frailty and worse health outcomes (Claesson et al., Nature, 2012).

The clinical relevance shows up in the obesity data. People with obesity tend to carry less diverse microbiomes and a greater capacity to pull energy out of food. In the foundational experiments, gut bacteria from obese mice were transplanted into germ-free mice, and the recipients gained more fat on the same caloric intake (Turnbaugh et al., Nature, 2006). The earlier work that set this up was a profiling study rather than a transplant, showing that ob/ob mice carry a different microbial composition than lean littermates (Ley et al., PNAS, 2005). Worth keeping those two straight, since they get merged constantly.

The mechanism comes down to metabolites. Microbes in the colon ferment fiber into short-chain fatty acids such as acetate, propionate, and butyrate. These influence GLP-1 and PYY, shift fat metabolism, and trigger inflammatory pathways that feed insulin resistance (Islam et al., Nutrients, 2022; Kong et al., Front Neurosci, 2021). High-fat diets also weaken the gut barrier, letting lipopolysaccharides leak into circulation. That process, metabolic endotoxemia, promotes systemic inflammation, insulin resistance, and weight gain (Kobyliak et al., Nutr J, 2016).

Antibiotic exposure adds another layer. A JAMA Network Open cohort followed 5,128 New Zealand children and found that 95% had received at least one antibiotic course before age four. Those with more than nine courses had 2.4 times the odds of obesity by age 4.5, and the association was strongest when exposure began before the first birthday (Chelimo et al., 2020). Animal models mirror it. Low-dose antibiotics given at weaning increased fat mass and altered metabolic pathways (Cho et al., Nature, 2012).

The microbiome talks to the brain as well. Microbial metabolites affect ghrelin, leptin, GLP-1, and CCK, the hormones that govern appetite, mood, and satiety (Van Son et al., Int J Mol Sci, 2021). That may be part of why chronic stress, anxiety, and disordered eating so often travel alongside changes in gut composition.

So where does this land in practice? Obesity treatment has to reach past calorie restriction. Supporting a healthy microbiome matters. Fiber-rich diets, probiotics, and prebiotics are under study as low-risk interventions. Synbiotics, which combine the two, are being evaluated as well. Fecal microbiota transplantation remains research territory. Even bariatric surgery outcomes may be partly explained by microbial shifts (Kovatcheva-Datchary et al., Cell Metab, 2015).

I have seen patients become more open to dietary change once they understand that what they eat feeds their microbes as much as it feeds them. That reframe carries weight. It moves the focus from restriction to partnership, from fighting the body to working with it.

Scott Rennie, D.O.

References:

1. Claesson MJ, et al. Gut microbiota composition correlates with diet and health in the elderly. Nature. 2012;488(7410):178-184. https://pubmed.ncbi.nlm.nih.gov/22797518/

2. Turnbaugh PJ, et al. An obesity-associated gut microbiome with increased capacity for energy harvest. Nature. 2006;444(7122):1027-1031. https://pubmed.ncbi.nlm.nih.gov/17183312/

3. Ley RE, et al. Obesity alters gut microbial ecology. Proc Natl Acad Sci USA. 2005;102(31):11070-11075. https://pubmed.ncbi.nlm.nih.gov/16033867/

4. Islam MR, et al. Nutrients. 2022;14(3):624.

5. Kong D, et al. Front Neurosci. 2021;15:755845.

6. Kobyliak N, et al. Nutr J. 2016;15:43.

7. Chelimo C, et al. Associations of Prenatal and Childhood Antibiotic Exposure With Obesity at Age 4 Years. JAMA Netw Open. 2020;3(1):e1917577. https://pubmed.ncbi.nlm.nih.gov/31977058/

8. Cho I, et al. Antibiotics in early life alter the murine colonic microbiome and adiposity. Nature. 2012;488(7413):621-626. https://pubmed.ncbi.nlm.nih.gov/22914093/

9. Van Son J, et al. Int J Mol Sci. 2021;22(6):2993.

10. Kovatcheva-Datchary P, et al. Cell Metab. 2015;22(6):971-982.

Board Certified in Obesity Medicine and Family Medicine

This blog is for educational purposes only and does not constitute individual medical advice. Always consult your own physician before making changes to your health, medications, or treatment plan.

Food Addiction and Obesity: How the Brain Is Involved

The human brain gets described as an engineering marvel. Like any product, it ships with vulnerabilities. Evolution built a system for surviving scarcity, and we now run that system in an environment of constant stimulation and engineered food. The mismatch explains a great deal about why obesity and addiction share so much ground.

One useful way to frame it is in terms of failure modes. Sometimes the design itself creates the problem. Sometimes development goes off track. And sometimes a perfectly good brain breaks down under conditions no brain was built for.

Take the design. We evolved to crave calorie-dense food because it was scarce and it kept us alive. Sugar and fat are now everywhere, and those old drives get hijacked. Food companies understand how to exploit them, the same way addictive substances exploit the same reward circuitry. The biology has not changed. The environment has.

Development matters too. Prenatal nutrition, early childhood adversity, and other disruptions shape how the brain handles reward and stress. Analysis of roughly 2,700 children in the NIH-funded ABCD Study found that higher BMI was associated with thinner cortex, particularly in prefrontal regions, and with lower working memory on list-sorting tasks (Laurent et al., 2020). Brain development itself appears alterable in the setting of poor diet and excess weight.

Then there are the extreme conditions. Trauma, chronic stress, and social adversity overwhelm coping systems, and food and drugs become the fallback. Calling that a failure of willpower misses what is happening. The brain is adapting, badly, to circumstances it can’t otherwise handle. It also helps explain why obesity and addiction cluster in groups facing economic hardship and unstable environments.

Dopamine sits at the center of both. Dopamine does more than produce pleasure. It teaches the brain what to attend to and what to repeat. Eat sugar, dopamine surges, the brain takes note. Use a drug, same signal. With repeated exposure, dopamine receptors downregulate (Volkow et al., 2013). Tolerance builds. Soon more sugar or more drug is needed to reach baseline.

Refined sugar is unusually effective in this loop. It spikes glucose fast, drives dopamine release, and slips past satiety signaling. Animal studies show sugar producing binge-like intake patterns and withdrawal signs on removal (Avena et al., Neurosci Biobehav Rev, 2008). In humans, high sugar intake has been linked to memory problems, greater inflammation, and impaired hippocampal function (Kendig, Appetite, 2014). Which is why cutting sugar feels less like breaking a habit and more like breaking an addiction.

So what helps? Supporting the brain at each stage. Protecting the developing brain through prenatal nutrition and limiting early sugar exposure. Teaching children coping skills, protecting sleep, and building activity, all of which strengthen the prefrontal cortex that reins in impulse. Reducing ultra-processed food at home and in schools.

Medications now target this signaling directly. GLP-1 receptor agonists act on satiety hormones in the gut and on brain pathways that regulate appetite. They reset the system rather than substituting for resolve.

Research is moving toward brain-based interventions: neurofeedback, brain stimulation, digital tools that reinforce healthier behavior in real time. The underlying message has not changed. Obesity and addiction are brain-based conditions shaped by biology, environment, and lived experience. Recognizing that changes how we treat and support the people in front of us, without letting anyone off the hook for their own care.

Scott Rennie, D.O.

References:

1. Laurent JS, et al. Associations Among Body Mass Index, Cortical Thickness, and Executive Function in Children. JAMA Pediatr. 2020;174(2):170-177. https://pubmed.ncbi.nlm.nih.gov/31816020/

2. Volkow ND, Wang GJ, Tomasi D, Baler RD. Obesity and addiction: neurobiological overlaps. Obes Rev. 2013;14(1):2-18. https://pubmed.ncbi.nlm.nih.gov/23016694/

3. Avena NM, Rada P, Hoebel BG. Evidence for sugar addiction: behavioral and neurochemical effects of intermittent, excessive sugar intake. Neurosci Biobehav Rev. 2008;32(1):20-39. https://pubmed.ncbi.nlm.nih.gov/17617461/

4. Kendig MD. Cognitive and behavioural effects of sugar consumption in rodents: a review. Appetite. 2014;80:41-54. https://pubmed.ncbi.nlm.nih.gov/24816323/

Board Certified in Obesity Medicine and Family Medicine

This blog is for educational purposes only and does not constitute individual medical advice. Always consult your own physician before making changes to your health, medications, or treatment plan.

How Processed Food Disrupts the Gut Brain Connection

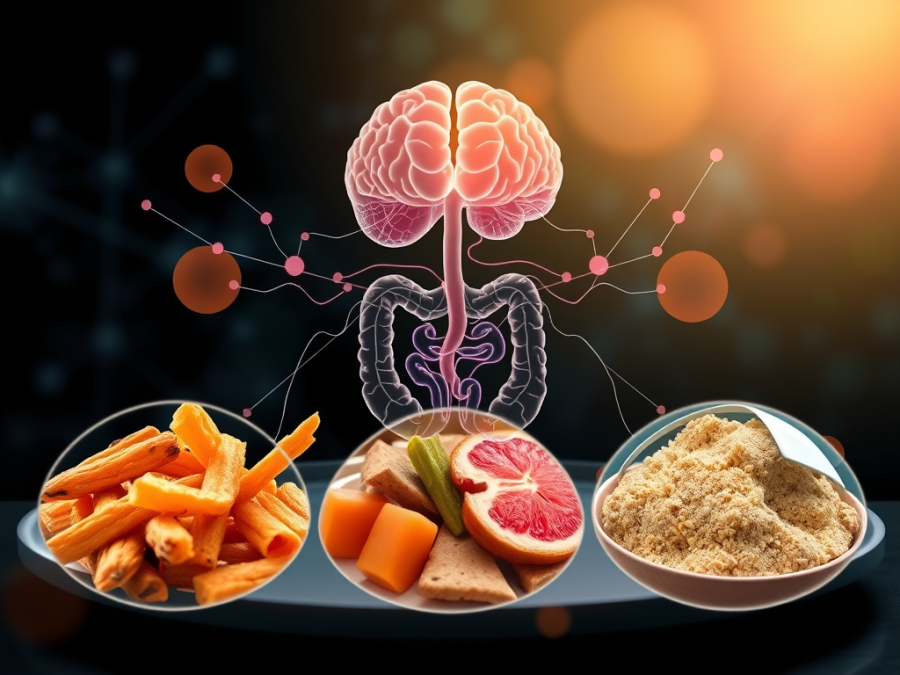
For years we told patients obesity came down to calories in and calories out. The research has moved. The gut-brain axis, the two-way traffic between the digestive system and the central nervous system, sits at the center of hunger, satiety, and reward. When it works, it regulates intake without conscious effort. Against the current food supply, it often doesn’t work.

The axis runs on neural, hormonal, and metabolic signals. After a meal, the gut reports what came in, how much, and when to stop. That system evolved for whole foods and scarce calories. It was never built for a diet dominated by processed, energy-dense products.

Alexandra DiFeliceantonio and Dana Small have argued that modern food disrupts the system by creating mismatches between what the gut senses and how the brain responds (Small & DiFeliceantonio, Science, 2019). Three features stand out.

The first is macronutrient combination. Fat and refined carbohydrate rarely appear together in high amounts in nature. Most processed food delivers both. People assign higher value to fat-carb combinations even when calories are held constant. In one controlled experiment, participants bid more money for foods containing both than for foods containing either alone (DiFeliceantonio et al., Cell Metab, 2018).

Speed of absorption is the second. Highly processed foods deliver calories fast, producing stronger responses in glucose metabolism and reward pathways (Carmody et al., PNAS, 2011; Hall et al., Cell Metab, 2019). Rodents develop stronger preferences for rapidly metabolized foods. In humans, faster eating rate tracks with weight gain.

Additives are the third. Sweeteners, emulsifiers, and artificial flavors make food more palatable while confusing the signaling underneath. When sweet taste stops reliably predicting calorie content, the brain loses the ability to regulate intake based on prior experience (Dalenberg et al., Cell Metab, 2020). The body learns that taste no longer matches nutrition.

The evidence supports the picture. People with obesity show altered valuation of high-reward foods compared with lean individuals (Perszyk et al., Nutrients, 2021). Rodents fed cafeteria-style diets full of energy-dense processed food overeat and gain weight, while chow-fed controls hold steady (Johnson & Kenny, Nat Neurosci, 2008; Beilharz et al., Front Psychol, 2014). Neuroimaging shows the striatum responding differently to fat-carb combinations than to single macronutrients (DiFeliceantonio et al., 2018).

All of which points at something uncomfortable. The modern food environment may overwhelm and distort the very systems built to keep intake in check. That is a real explanation for why “eat less, move more” fails so often. The advice assumes intact gut-brain signaling in people whose signaling is already compromised.

The open research question is how to restore it. Diets built around foods that reinforce reliable gut-brain communication. Studies of how additives affect hormonal and neural markers of satiety. Behavioral work helping patients relearn hunger and fullness cues.

Clinically, the thing worth holding onto is the environment patients are choosing inside. A food supply engineered to exploit biological vulnerabilities will beat most people’s intentions, and restoring the fidelity of that signaling may be where the real leverage sits.

Scott Rennie, D.O.

References:

1. Small DM, DiFeliceantonio AG. Processed foods and food reward. Science. 2019;363(6425):346-347. https://pubmed.ncbi.nlm.nih.gov/30679360/

2. DiFeliceantonio AG, et al. Supra-Additive Effects of Combining Fat and Carbohydrate on Food Reward. Cell Metab. 2018;28(1):33-44.e3. https://pubmed.ncbi.nlm.nih.gov/29909968/

3. Carmody RN, Weintraub GS, Wrangham RW. Energetic consequences of thermal and nonthermal food processing. Proc Natl Acad Sci USA. 2011;108(48):19199-19203. https://pubmed.ncbi.nlm.nih.gov/22065771/

4. Hall KD, et al. Ultra-Processed Diets Cause Excess Calorie Intake and Weight Gain. Cell Metab. 2019;30(1):67-77.e3. https://pubmed.ncbi.nlm.nih.gov/31105044/

5. Dalenberg JR, et al. Short-Term Consumption of Sucralose with, but not without, Carbohydrate Impairs Neural and Metabolic Sensitivity to Sugar in Humans. Cell Metab. 2020;31(3):493-502.e7. https://pubmed.ncbi.nlm.nih.gov/32130879/

6. Perszyk EE, et al. Nutrients. 2021;13(11):3846.

7. Johnson PM, Kenny PJ. Dopamine D2 receptors in addiction-like reward dysfunction and compulsive eating in obese rats. Nat Neurosci. 2010;13(5):635-641. https://pubmed.ncbi.nlm.nih.gov/20348917/

8. Beilharz JE, Maniam J, Morris MJ. Front Psychol. 2014;5:1454.

Board Certified in Obesity Medicine and Family Medicine

This blog is for educational purposes only and does not constitute individual medical advice. Always consult your own physician before making changes to your health, medications, or treatment plan.

How Parents Influence a Child’s Weight and Eating

Childhood obesity has little to do with a child’s willpower. Biology, environment, and daily routine shape it. Genetics matter. So does the household, and that is where parents hold real leverage: how they feed, how they structure the day, what they model.

None of what follows is about blame. It is about where the leverage actually sits.

The clearest example starts in infancy. Responsive feeding means reading hunger and fullness cues instead of pressuring or ignoring them, and it has been linked to healthier eating patterns and weight gain matched to a child’s needs (Ventura, Adv Nutr, 2017). A parent who notices a baby turning away from the bottle and respects that signal is teaching self-regulation. The “clean your plate” approach many of us grew up with does the opposite. It overrides the signal and sets up overeating later (Johnson & Birch, Pediatrics, 1994).

Breastfeeding is where the popular version of this claim outruns the evidence. Observational studies associate exclusive and longer breastfeeding with lower obesity risk, with reductions sometimes quoted around 24%. The review most often cited for that number argues the observational literature is heavily confounded by socioeconomic status, maternal weight, and the feeding practices that travel alongside breastfeeding, and that randomized and sibling-comparison designs show a far weaker effect (Woo & Martin, Curr Obes Rep, 2015). Breastfeeding is worth supporting on its own merits. Promising parents it will prevent obesity goes past what the data support.

Parents also teach by example. A child who regularly sees a parent eating vegetables or trying something unfamiliar is more likely to do it. Repeated exposure paired with parental modeling makes children more willing to accept foods they would otherwise refuse. Using food as a reward runs the other way. Saying “you can have dessert if you eat your broccoli” teaches a child that sweets are the prize and broccoli is the toll (Newman & Taylor, J Exp Child Psychol, 1992).

The home environment does quiet work. Fruit and vegetables visible and easy to grab, energy-dense snacks harder to reach, and children drift toward the better option without a rule being enforced. Family meals matter too. The link to diet quality is consistent even where the direct effect on weight is murkier. They add structure and cut down on distracted eating.

Sleep and activity belong in the same conversation. Short sleep and heavy screen time in early childhood both raise obesity risk. Parents who hold bedtimes, encourage active play, and set limits on screens are shaping energy balance in ordinary daily ways.

Some strategies backfire. Restriction is the main one. In a well-known experiment, restricting children’s access to a particular snack increased both their desire for it and how much they ate when it became available, compared with an unrestricted food (Fisher & Birch, Appetite, 1999). Using food to soothe emotion has a similar problem. It builds an association between eating and comfort that persists into adult life.

Genetics play their part. Some children are more sensitive to food cues and less attuned to satiety, and twin studies put real numbers on that heritability (Wardle, Carnell & Plomin, Am J Clin Nutr, 2008). Even so, a supportive home makes a measurable difference in children carrying that predisposition. Responsive feeding, structure, and consistent modeling buffer inherited risk.

For families already struggling, family-based behavioral treatment has trial evidence behind it. The model runs on collaborative goal-setting, structured monitoring, and positive reinforcement, and it improves child weight outcomes in ways that hold up over time (Wilfley et al., JAMA Pediatr, 2017). Parent-only versions of the same treatment perform comparably to parent-and-child versions, which matters for families who can’t get everyone to an appointment (Boutelle et al., Appetite, 2021).

Parents don’t cause obesity. They do hold leverage points that matter, from infancy through adolescence, in how food, sleep, stress, and activity get managed at home.

Scott Rennie, D.O.

References:

1. Ventura AK. Does Breastfeeding Shape Food Preferences? Links to Obesity. Adv Nutr. 2017;8(1):149-150.

2. Johnson SL, Birch LL. Parents’ and children’s adiposity and eating style. Pediatrics. 1994;94(5):653-661. https://pubmed.ncbi.nlm.nih.gov/7936891/

3. Woo JG, Martin LJ. Does Breastfeeding Protect Against Childhood Obesity? Moving Beyond Observational Evidence. Curr Obes Rep. 2015;4(2):207-216. https://pubmed.ncbi.nlm.nih.gov/26100032/

4. Newman J, Taylor A. Effect of a means-end contingency on young children’s food preferences. J Exp Child Psychol. 1992;53(2):200-216. https://pubmed.ncbi.nlm.nih.gov/1578198/

5. Fisher JO, Birch LL. Restricting access to foods and children’s eating. Appetite. 1999;32(3):405-419. https://pubmed.ncbi.nlm.nih.gov/10336797/

6. Wardle J, Carnell S, Haworth CM, Plomin R. Evidence for a strong genetic influence on childhood adiposity despite the force of the obesogenic environment. Am J Clin Nutr. 2008;87(2):398-404. https://pubmed.ncbi.nlm.nih.gov/18258631/

7. Wilfley DE, et al. Dose, Content, and Mediators of Family-Based Treatment for Childhood Obesity. JAMA Pediatr. 2017;171(12):1151-1159. https://pubmed.ncbi.nlm.nih.gov/29084318/

8. Boutelle KN, et al. Appetite. 2021.

Board Certified in Obesity Medicine and Family Medicine

This blog is for educational purposes only and does not constitute individual medical advice. Always consult your own physician before making changes to your health, medications, or treatment plan.

Childhood Food Insecurity: What Doctors and Families Can Do

Food insecurity means the lack of consistent access to enough food for a healthy, active life. Hunger is part of it. The rest reaches into development, school performance, behavior, and long-term health, and millions of children in this country live inside it.

In pediatrics it surfaces quietly. A child who can’t concentrate at school. A family that skips meals at the end of the month. A growth curve that looks off and doesn’t fit the usual explanations. Treating it as a clinical problem rather than a social one is where the work starts.

The scope is wide. In 2024, 13.7% of U.S. households experienced food insecurity at some point during the year, and among households with children the figure was 18.4% (1). That is up sharply from the 10.5% recorded in 2020. Children carry the heaviest burden. The literature links food insecurity to iron-deficiency anemia, delayed motor and cognitive development, poor school performance, and behavioral problems including depression and inattention (Cook et al., J Nutr, 2004; Casey et al., Pediatrics, 2006).

Food insecurity and obesity travel together, which surprises most parents. Economic pressure pushes families toward calorie-dense, low-cost food. Scarcity itself can trigger binge eating when food becomes available. Stress and parenting under pressure add another layer. Children get urged to clean their plates, or food becomes the tool for soothing. Children aged 10 to 15 in food-insecure households are more likely to carry higher BMI and adiposity (Tester et al., Curr Obes Rep, 2020).

Geography tells its own story. The Southeastern U.S. carries some of the highest rates of both food insecurity and childhood obesity. Mississippi, Arkansas, Louisiana, New Mexico, and Texas rank among the hardest hit for food insecurity. Mississippi, West Virginia, Kentucky, Alabama, and Oklahoma consistently report the highest pediatric obesity rates. The overlap is no coincidence. Rural areas, tribal lands, and parts of Appalachia function as food deserts, where grocery stores are scarce and convenience stores and fast food fill the gap. Poverty and underinvestment in health infrastructure compound it.

So how do we find it? Most pediatric settings use the Hunger Vital Sign, a two-question screener drawn from the USDA’s 18-item scale and endorsed by the American Academy of Pediatrics. Against the full scale it runs 97% sensitive and 83% specific (Hager et al., Pediatrics, 2010; AAP Council on Community Pediatrics, Pediatrics, 2015). It asks families to respond to two statements:

“We worried whether our food would run out before we got money to buy more.”

“The food we bought just didn’t last, and we didn’t have money to get more.”

An answer of “often true” or “sometimes true” to either one signals risk. It is short, it embeds cleanly in an EMR, and it has been validated across languages. Longer tools exist, including the USDA’s full 18-item module, its 6-item short form, and the 9-item youth survey, but the time cost usually rules them out.

Screening is harder to implement than it sounds. Time, competing priorities, and plain discomfort discussing money are real barriers. Self-administered forms, EMR prompts, and universal framing all help. Telling every family “we ask everyone about food, because it’s central to health” takes the sting out of the question. When a screen comes back positive, the referral pathway has to already exist, whether that means SNAP and WIC enrollment, food pantries, or school meal programs.

Federal nutrition programs remain the strongest safety net. SNAP provides grocery support. WIC offers food vouchers, nutrition education, and breastfeeding support. The National School Lunch and School Breakfast Programs cover the school year, and the Summer Food Service Program covers the gap when school is out. The evidence doesn’t support the worry that these programs worsen obesity risk. WIC participation tracked with a decline in obesity among children aged 2 to 4 across 2010 to 2016 (Pan et al., MMWR, 2019). Stable SNAP benefits reduce the time children spend with obesity compared with non-participants (Au et al., J Nutr, 2019).

For clinicians the task splits in two: identify and connect. Screening is the first half. The impact comes from linking families to something real, which might mean a referral list built into the EMR, a relationship with a local enrollment center, or a standing partnership with a community food bank. Even asking “would it help if I connected you with resources that provide healthy food?” moves something.

Food insecurity is a health problem, and it shows up in front of us constantly. Naming it, screening for it, and acting on it protects children from consequences that reach a long way forward.

Scott Rennie, D.O.

References:

1. Rabbitt MP, et al. Household Food Security in the United States in 2024. USDA Economic Research Service, ERR-358, December 2025. https://www.ers.usda.gov/publications/pub-details?pubid=113622

2. Cook JT, et al. Food insecurity is associated with adverse health outcomes among human infants and toddlers. J Nutr. 2004;134(6):1432-1438. https://pubmed.ncbi.nlm.nih.gov/15173408/

3. Casey PH, et al. Child health-related quality of life and household food security. Pediatrics. 2006;118(5):e1406-e1413. https://pubmed.ncbi.nlm.nih.gov/17079542/

4. Hager ER, et al. Development and validity of a 2-item screen to identify families at risk for food insecurity. Pediatrics. 2010;126(1):e26-e32. https://pubmed.ncbi.nlm.nih.gov/20595453/

5. Council on Community Pediatrics, Committee on Nutrition. Promoting Food Security for All Children. Pediatrics. 2015;136(5):e1431-e1438. Reaffirmed 2021. https://publications.aap.org/pediatrics/article/136/5/e1431/33896/

6. Tester JM, Rosas LG, Leung CW. Food Insecurity and Pediatric Obesity. Curr Obes Rep. 2020;9(4):562-570.

7. Au LE, et al. J Nutr. 2019;149(9):1642-1650.

8. Pan L, et al. Trends in Obesity Among Participants Aged 2 to 4 Years in WIC, United States, 2010 to 2016. MMWR Morb Mortal Wkly Rep. 2019;68(45):1057-1061. https://www.cdc.gov/mmwr/volumes/68/wr/mm6845a2.htm

Board Certified in Obesity Medicine and Family Medicine

This blog is for educational purposes only and does not constitute individual medical advice. Always consult your own physician before making changes to your health, medications, or treatment plan.
Childhood Obesity: How It’s Prevented and Treated

Childhood obesity is a chronic disease affecting roughly 14.7 million children and adolescents in the United States, and growth charts and BMI percentiles are the least interesting part of it. The American Academy of Pediatrics said as much in its 2023 Clinical Practice Guideline, which reframes obesity as a condition deserving the same urgency and structure we bring to any other chronic disease.

The guideline is built around 13 key action statements plus a set of consensus recommendations. The message running through all of them is that waiting doesn’t work. Early, structured intervention does.

The first shift is consistent screening. Pediatricians should measure height, weight, and BMI annually for every child between 2 and 18. Once BMI reaches the 85th percentile, the number stops being the point and the evaluation begins: dyslipidemia, prediabetes, fatty liver disease, hypertension, sleep apnea. That workup includes history, physical examination, and a careful look at social and environmental context.

For children over 10 with obesity, the guideline recommends a fuller lab evaluation. Fasting glucose or A1c, a lipid panel, liver enzymes, and where indicated a sleep study or a PCOS evaluation in adolescent girls. Depression screening belongs in that set too. Obesity travels with comorbidities, and treating one while ignoring the others misses most of the disease.

Once the diagnosis is made, treatment starts. Not next visit. The model is family-centered and non-stigmatizing, and motivational interviewing sits at the center of it because it lets clinicians surface ambivalence, name barriers, and set goals with families rather than at them.

The cornerstone is Intensive Health Behavior and Lifestyle Treatment. IHBLT is structured and sustained in a way brief counseling never is. The evidence supports at least 26 hours of face-to-face individual or group contact over 3 to 12 months, delivered by a multidisciplinary team of physicians, dietitians, behavioral health providers, and exercise professionals. That threshold is where outcomes start to move, and it applies to children as young as 6.

Nutrition counseling focuses on limiting calorie-dense, nutrient-poor food and increasing fruit, vegetables, and lean protein. Activity goals scale by age, with 60 minutes of moderate-to-vigorous movement daily as the benchmark for school-aged children. Behavioral strategies cover self-monitoring, goal setting, and problem solving. Parental involvement is central rather than optional, and programs that engage parents in the behavior change itself see better outcomes.

For families, this looks nothing like being told to eat better and move more. The intensity and the support structure are what shift the needle.

Not every family can reach a program like that. Geography, insurance, and local capacity all get in the way. The guideline acknowledges it and asks providers to deliver the most comprehensive care available while advocating for expanded community-based IHBLT.

Pharmacologic therapy is the next tier. Adolescents 12 and older may be offered FDA-approved weight-loss medication as an adjunct to health behavior and lifestyle treatment, according to each drug’s indications, risks, and benefits. Twelve is the floor. Medications are adjuncts to behavioral treatment rather than replacements for it.

Metabolic and bariatric surgery is addressed as well. For adolescents 13 and older with severe obesity, defined as BMI at or above 120% of the 95th percentile, the guideline supports referral to a comprehensive pediatric surgical center for evaluation.

The guideline also spends real attention on social determinants. Families dealing with poverty, food insecurity, systemic inequity, or nowhere safe to play are facing barriers that have nothing to do with individual willpower. Effective treatment has to acknowledge that and work on it where it can.

For practicing clinicians the roadmap is short: treat when obesity is identified, use motivational interviewing, refer to or provide IHBLT, manage comorbidities in parallel, and advocate for families against stigma and structural barriers.

Sandra Hassink, who helped lead the work, put the central point plainly when the guideline was released: “There is no evidence that ‘watchful waiting’ or delayed treatment is appropriate for children with obesity.”

Scott Rennie, D.O.

References:

1. Hampl SE, Hassink SG, Skinner AC, et al. Clinical Practice Guideline for the Evaluation and Treatment of Children and Adolescents With Obesity. Pediatrics. 2023;151(2):e2022060640. https://publications.aap.org/pediatrics/article/151/2/e2022060640/190443/

2. Executive Summary: Clinical Practice Guideline for the Evaluation and Treatment of Children and Adolescents With Obesity. Pediatrics. 2023;151(2):e2022060641. https://publications.aap.org/pediatrics/article/151/2/e2022060641/190440/

3. American Academy of Pediatrics. Clinical Practice Guideline for the Evaluation and Treatment of Pediatric Obesity: resources and implementation tools. https://www.aap.org/obesitycpg

Board Certified in Obesity Medicine and Family Medicine

This blog is for educational purposes only and does not constitute individual medical advice. Always consult your own physician before making changes to your health, medications, or treatment plan.

What Brain Scans Show About Appetite and Overeating

Patients say a version of the same thing constantly: “I know what I should eat, but I still crave the wrong things.” That gap between knowledge and behavior is what pushed researchers toward the brain. Functional MRI has shown that appetite runs on circuits that defend fat mass and respond to food cues, and that willpower is a small part of the story.

For years we leaned on BMI as the working definition of obesity. A BMI over 30 got the label, and the number explained nothing about why weight gain happened or why some patients struggle far more than others. Schwartz and colleagues reframed it in 2017 as “a disorder of energy homeostasis, characterized by the defense of an elevated body fat mass” (Schwartz et al., Endocr Rev, 2017). That definition earns its keep. It says the body is working to hold fat stores high, and that when weight comes off, biology answers with stronger hunger signaling, slower metabolism, and shifted hormones.

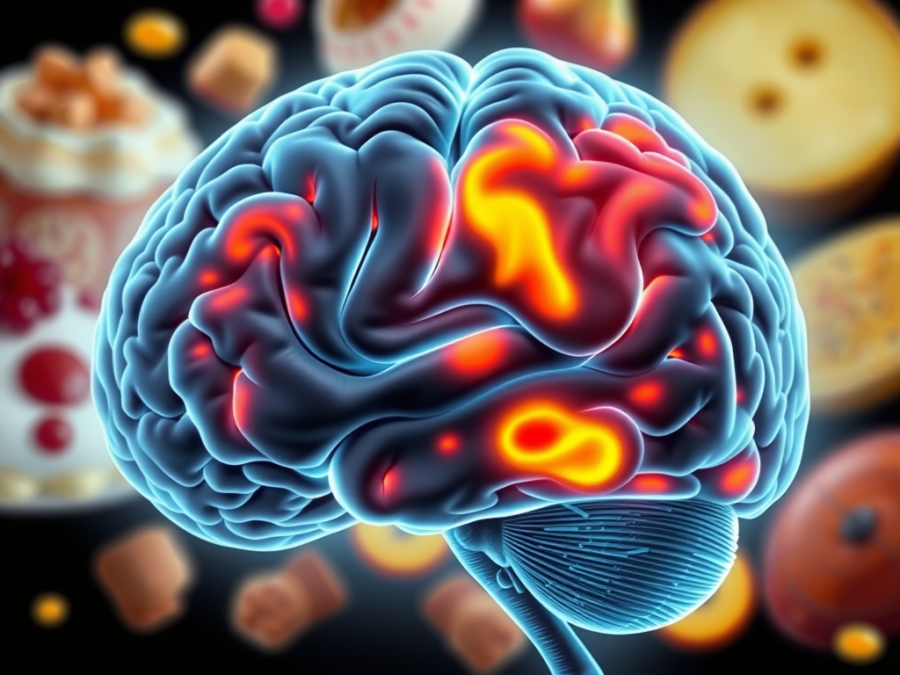
The gut-fat-brain conversation sits at the center. Leptin, ghrelin, insulin, GLP-1, and PYY all shape hunger and satiety, and fMRI shows how those signals land. High-calorie food cues light up the amygdala, striatum, medial orbitofrontal cortex, and ventral tegmental area, all reward and craving territory (Schur et al., Int J Obes, 2009; Melhorn et al., Am J Clin Nutr, 2018). After weight loss, that reward response doesn’t fade, which is a large part of why relapse is the rule. Interventions do move it. Leptin replacement, intranasal insulin, GLP-1 agonists, and bariatric surgery all reduce this activation (Holsen et al., Int J Obes, 2018; van Bloemendaal et al., Diabetes, 2014).

One finding deserves more attention than it gets: looking at pictures of calorie-dense food predicts what people actually eat. In studies where participants later chose from a buffet, those with higher reward activation to food images selected more high-fat, high-calorie items. The brain response translated into behavior at the table.

That has treatment implications. Patients with persistent reward-driven responses may get the most from GLP-1 agonists like semaglutide. For others, agents acting on central insulin or leptin signaling may fit better. Bupropion-naltrexone targets reward pathways directly and may suit patients where hedonic eating is the main driver. Obesity is a brain-based condition, and it needs brain-aware treatment.

Inflammation belongs in this picture too. Valdearcos and colleagues showed that rodents on a high-fat diet developed hypothalamic gliosis, an inflammatory response in the brain, before they gained significant weight (Valdearcos et al., Cell Metab, 2017). Human MRI findings line up. Individuals with obesity are more likely to show signs of hypothalamic gliosis (Schur et al., Obesity, 2015; Kreutzer et al., Diabetes, 2017). Inflammation may disrupt appetite regulation early, helping drive the defense of elevated fat mass.

For clinicians, this changes the posture. Blaming patients for “failing” when weight returns misreads the physiology. Their biology is built to resist fat loss. Medications acting on appetite centers belong in long-term care rather than short courses. Diet quality may matter for brain inflammation as well as calorie balance. And as with any other chronic disease, the expectation should be continuous management rather than a one-time fix.

Framing obesity as a chronic brain and inflammatory disease does something useful for the room. It takes stigma out of it. Patients are living with a condition in which the brain defends fat mass through powerful signals, and that framing replaces shame with something we can actually treat.

Scott Rennie, D.O.

References:

1. Schwartz MW, Seeley RJ, Zeltser LM, et al. Obesity Pathogenesis: An Endocrine Society Scientific Statement. Endocr Rev. 2017;38(4):267-296. https://pubmed.ncbi.nlm.nih.gov/28898979/

2. Schur EA, et al. Activation in brain energy regulation and reward centers by food cues varies with choice of visual stimulus. Int J Obes (Lond). 2009;33(6):653-661. https://pubmed.ncbi.nlm.nih.gov/19365394/

3. Melhorn SJ, et al. Am J Clin Nutr. 2018;107(4):574-582.

4. Holsen LM, et al. Int J Obes (Lond). 2018;42(4):785-793.

5. van Bloemendaal L, et al. GLP-1 receptor activation modulates appetite- and reward-related brain areas in humans. Diabetes. 2014;63(12):4186-4196. https://pubmed.ncbi.nlm.nih.gov/25071023/

6. Valdearcos M, et al. Microglial Inflammatory Signaling Orchestrates the Hypothalamic Immune Response to Dietary Excess and Mediates Obesity Susceptibility. Cell Metab. 2017;26(1):185-197.e3. https://pubmed.ncbi.nlm.nih.gov/28683286/

7. Kreutzer C, et al. Hypothalamic Inflammation in Human Obesity Is Mediated by Environmental and Genetic Factors. Diabetes. 2017;66(9):2407-2415. https://pubmed.ncbi.nlm.nih.gov/28576837/

8. Schur EA, et al. Radiologic evidence that hypothalamic gliosis is associated with obesity and insulin resistance in humans. Obesity (Silver Spring). 2015;23(11):2142-2148. https://pubmed.ncbi.nlm.nih.gov/26530930/

Board Certified in Obesity Medicine and Family Medicine

This blog is for educational purposes only and does not constitute individual medical advice. Always consult your own physician before making changes to your health, medications, or treatment plan.
Doctor Supervised Weight Loss: What Works Long Term

Telling patients to eat less and move more doesn’t cut it. Obesity is a chronic disease, and progress requires structured, ongoing, individualized care. The hardest part clinically is making sure the weight that comes off is fat rather than muscle.

Losing muscle costs more than strength. It costs independence, recovery capacity, and eventually survival. Older adults and patients with low baseline activity are the most exposed. Poorly managed weight loss produces sarcopenia, the loss of muscle mass and function. Layer excess fat on top and you get sarcopenic obesity, where a patient looks heavy and is functionally weak and metabolically compromised at the same time.

The European Working Group on Sarcopenia in Older People sets out how to catch it early. It starts with loss of strength, measured by grip strength or a chair-stand test. DXA or BIA can confirm low muscle mass. Poor strength plus low mass plus reduced physical performance defines severe sarcopenia. These definitions give us a framework to act before decline becomes permanent (Cruz-Jentoft et al., Age Ageing, 2019).

Muscle mass predicts survival on its own. Appendicular Lean Mass Index, lean tissue in the arms and legs divided by height squared, is a reliable measure, and people in the top quartile carry substantially lower all-cause mortality than those in the lowest, even after adjusting for BMI and comorbidities (Srikanthan & Karlamangla, Am J Med, 2014). Put plainly, a patient with stronger arms and legs has better odds of living longer regardless of what the scale says.

Strength testing matters as much as mass. Low grip strength tracks with higher mortality from cardiovascular disease, cancer, and respiratory illness. Poor lower-body strength, showing up as slower gait speed or difficulty rising from a chair, tracks with frailty, hospitalization, and long-term disability.

Both measures are cheap and fast, and both are underused. Grip strength needs a dynamometer and a hand to put it in, which rules it out of any remote encounter. The 30-second sit-to-stand doesn’t. A hard chair, arms crossed over the chest, as many stands as the patient can complete in thirty seconds, counted by whoever is watching. It works over video as well as it works in a room, and it yields a number worth tracking across visits. One usable functional measure beats a chart full of weights.

Nutrition is the cornerstone of preserving muscle during weight loss. The baseline protein RDA of 0.8 g/kg/day is inadequate for many adults, particularly older patients and anyone in a calorie deficit. The evidence supports closer to 1.2 to 1.6 g/kg/day, and up to 2.0 g/kg/day in some medically supervised cases (Paddon-Jones et al., Am J Clin Nutr, 2015; Bauer et al., J Am Med Dir Assoc, 2013). Spacing intake across meals rather than loading it at dinner sustains muscle protein synthesis better. Whey and casein, soy, eggs, and blended plant sources all work.

Calculating a target in patients with obesity is genuinely awkward. Actual body weight overshoots. Ideal body weight undershoots. Adjusted body weight is the usual compromise, and reasonable clinicians disagree about which to use. For a 5’6″ patient, a target weight around 73 kg at 1.5 g/kg puts the daily goal near 110 grams, which is a number a patient can actually work with.

Exercise has to include both resistance and aerobic work. Resistance training protects and builds lean mass. Aerobic activity improves cardiovascular and metabolic health. A 2022 systematic review and meta-analysis found the combination conferred the greatest mortality risk reduction, and notably found that weight training alone wasn’t associated with lower mortality among people doing no aerobic exercise (Shailendra et al., Am J Prev Med, 2022). For a patient that translates to brisk walking or cycling most days plus two or three weekly strength sessions using bands, weights, or bodyweight.

Think of muscle like a retirement account. Build it and hold it early, so it is there when it is needed. A patient in their seventies who lands in the hospital with pneumonia can lose a large fraction of their reserve to a few days of immobility and poor intake. If the reserve was thin going in, the decline may be permanent, and it shows up later as falls, fractures, and lost independence. Investing ahead of time changes that trajectory.

Medication is a real adjunct, and it has to be paired with strategies that protect lean tissue. GLP-1 receptor agonists produce substantial weight loss, and a meaningful fraction of that loss is lean mass. Adequate protein and resistance training are the mitigation strategies with actual evidence behind them, and body composition deserves monitoring wherever it is available rather than weight alone.

As clinicians, we need to screen past BMI. Ask about physical activity. Get a functional measure. Consider dietary adequacy. Refer to dietitians, physical therapists, or trainers where it helps, and even a single session with a trainer improves safety and confidence with resistance work. Set goals patients can hold: one to two pounds a week of fat loss while protecting muscle.

Obesity treatment is chronic care. The point is helping patients hold strength, mobility, and independence while metabolic health improves, and preserving muscle sits at the center of that.

Scott Rennie, D.O.

References:

1. Cruz-Jentoft AJ, et al. Sarcopenia: revised European consensus on definition and diagnosis. Age Ageing. 2019;48(1):16-31. https://pubmed.ncbi.nlm.nih.gov/30312372/

2. Srikanthan P, Karlamangla AS. Muscle mass index as a predictor of longevity in older adults. Am J Med. 2014;127(6):547-553. https://pubmed.ncbi.nlm.nih.gov/24561114/

3. Paddon-Jones D, et al. Protein and healthy aging. Am J Clin Nutr. 2015;101(6):1339S-1345S. https://pubmed.ncbi.nlm.nih.gov/25926511/

4. Bauer J, et al. Evidence-based recommendations for optimal dietary protein intake in older people: a position paper from the PROT-AGE Study Group. J Am Med Dir Assoc. 2013;14(8):542-559. https://pubmed.ncbi.nlm.nih.gov/23867520/

5. Shailendra P, et al. Resistance Training and Mortality Risk: A Systematic Review and Meta-Analysis. Am J Prev Med. 2022;63(2):277-285. https://pubmed.ncbi.nlm.nih.gov/35599175/

Board Certified in Obesity Medicine and Family Medicine

This blog is for educational purposes only and does not constitute individual medical advice. Always consult your own physician before making changes to your health, medications, or treatment plan.

What Is MASLD? The New Name for Fatty Liver Disease

Liver disease is showing up more often, and it tracks closely with rising rates of obesity, diabetes, and metabolic syndrome. What many of us trained calling “fatty liver” or NAFLD has been renamed and reframed. The term now is MASLD, metabolic dysfunction-associated steatotic liver disease, and it reflects a better understanding of what actually drives the condition.

Why the change? NAFLD was a definition by exclusion. It told you the disease was not caused by alcohol without saying what it was. It also excluded patients with both alcohol and metabolic drivers, and the word “fatty” carried stigma that most patients felt immediately. In 2023 a multisociety Delphi process involving 236 panelists from 56 countries settled on the new nomenclature. Sixty-six percent of respondents found “fatty” stigmatizing and 61% said the same of “nonalcoholic.” The new definition requires at least one of five cardiometabolic risk factors, and it added MetALD for patients with metabolic dysfunction who also drink significantly (Rinella et al., J Hepatol, 2023).

MASLD is common. Roughly 30% of U.S. adults are affected. Among people with diabetes that figure climbs above 60%, and up to 15% carry advanced fibrosis (Le et al., Clin Mol Hepatol, 2022). Worldwide it is projected to overtake hepatitis C and alcohol as the leading cause of cirrhosis, hepatocellular carcinoma, and liver transplant.

The liver isn’t where most of these patients die. Cardiovascular disease is the leading cause of death in MASLD. The same inflammatory and metabolic pathways that damage the liver drive atherosclerosis. Diabetes worsens MASLD and MASLD worsens diabetes. The relationship runs in both directions.

One point matters more than any other: liver enzymes are a poor marker of severity. Normal ALT and AST are entirely compatible with advanced fibrosis. Fibrosis stage is what predicts progression, complications, and mortality. In a meta-analysis of 4,428 patients, all-cause mortality rose with each fibrosis stage, reaching a relative risk of 3.42 at stage 4 compared with stage 0, and liver-related mortality reached 11.13 (Taylor et al., Gastroenterology, 2020; Ekstedt et al., Hepatology, 2015). That is why guidelines now point everything at fibrosis assessment.

In primary care, FIB-4 is the practical first step. Age, AST, ALT, and platelet count. Under 1.3 suggests low risk and those patients can generally stay in primary care. Above 2.67 means high risk and warrants hepatology referral. Intermediate scores land in a gray zone that usually needs imaging such as FibroScan or a blood-based marker like the ELF test. FibroScan is fast and non-invasive but loses accuracy in patients with obesity, which is a real limitation given who has this disease. MR elastography is the most accurate option and the least available.

Treatment still starts with lifestyle. Weight loss of 5 to 10% improves steatosis and inflammation. The Mediterranean pattern is consistently associated with lower liver fat and better insulin sensitivity. Exercise at 150 minutes a week of moderate activity reduces liver fat even without weight loss, which is worth telling patients who are discouraged by the scale. Cutting sugar-sweetened beverages and limiting fructose is standard advice. Coffee earns its reputation here: a meta-analysis of observational studies found coffee consumption associated with 35% lower odds of significant fibrosis, with three or more cups a day the threshold most often cited, caffeinated or not (Hayat et al., Nutrients, 2021).

Medication options are expanding. Vitamin E has histologic benefit in non-diabetic patients with biopsy-proven MASH, though long-term safety concerns persist. Statins remain badly underused and are safe in MASLD, and they should be prescribed for cardiovascular risk reduction (Kargiotis et al., World J Gastroenterol, 2015). GLP-1 receptor agonists reduce liver fat and support weight loss.

In March 2024, resmetirom became the first FDA-approved drug for MASH with fibrosis. It is a liver-directed thyroid hormone receptor-beta agonist. In the phase 3 MAESTRO-NASH trial, MASH resolution without worsening fibrosis occurred in 25.9% of patients on 80 mg and 29.9% on 100 mg, against 9.7% on placebo, and both doses beat placebo on fibrosis improvement (Harrison et al., NEJM, 2024). It is approved for adults with non-cirrhotic MASH and stage F2 to F3 fibrosis. Those response rates are meaningful and they are also modest, and patients should hear both halves.

Endoscopic and surgical options matter too. Endoscopic sleeve gastroplasty and intragastric balloons reduce liver fat and improve fibrosis. Bariatric surgery remains among the most effective interventions available, with a systematic review and meta-analysis finding NASH resolution in roughly half of patients and fibrosis improvement in about a third (Lee et al., Clin Gastroenterol Hepatol, 2019).

MASLD management has moved well outside hepatology. It needs primary care, cardiology, endocrinology, nutrition, and gastroenterology working the same problem. Screen at-risk patients with FIB-4, particularly those with diabetes or obesity. Counsel on weight and diet. Prescribe statins when indicated. Refer for advanced assessment when fibrosis is suspected.

MASLD reframes liver disease as part of the broader cardiometabolic picture. Treating it means protecting the liver while cutting cardiovascular risk, improving glycemic control, and addressing systemic inflammation. That is where the impact lives.

Scott Rennie, D.O.

References:

1. Rinella ME, Lazarus JV, Ratziu V, et al. A multisociety Delphi consensus statement on new fatty liver disease nomenclature. J Hepatol. 2023;79(6):1542-1556. https://pubmed.ncbi.nlm.nih.gov/37364790/

2. Le MH, et al. Global incidence of non-alcoholic fatty liver disease. Clin Mol Hepatol. 2022;28(4):841-850. https://pubmed.ncbi.nlm.nih.gov/36117442/

3. Taylor RS, et al. Association Between Fibrosis Stage and Outcomes of Patients With Nonalcoholic Fatty Liver Disease: A Systematic Review and Meta-Analysis. Gastroenterology. 2020;158(6):1611-1625.e12. https://pubmed.ncbi.nlm.nih.gov/32027911/

4. Ekstedt M, et al. Fibrosis stage is the strongest predictor for disease-specific mortality in NAFLD after up to 33 years of follow-up. Hepatology. 2015;61(5):1547-1554. https://pubmed.ncbi.nlm.nih.gov/25125077/

5. Hayat U, et al. Effect of Coffee Consumption on Non-Alcoholic Fatty Liver Disease Incidence, Prevalence and Risk of Significant Liver Fibrosis: Systematic Review with Meta-Analysis of Observational Studies. Nutrients. 2021;13(9):3042. https://pubmed.ncbi.nlm.nih.gov/34578919/

6. Kargiotis K, et al. World J Gastroenterol. 2015;21(25):7860-7868.

7. Harrison SA, et al. A Phase 3, Randomized, Controlled Trial of Resmetirom in NASH with Liver Fibrosis. N Engl J Med. 2024;390(6):497-509. https://pubmed.ncbi.nlm.nih.gov/38324483/

8. Lee Y, et al. Complete Resolution of Nonalcoholic Fatty Liver Disease After Bariatric Surgery: A Systematic Review and Meta-analysis. Clin Gastroenterol Hepatol. 2019;17(6):1040-1060.e11. https://pubmed.ncbi.nlm.nih.gov/30326299/

Board Certified in Obesity Medicine and Family Medicine

This blog is for educational purposes only and does not constitute individual medical advice. Always consult your own physician before making changes to your health, medications, or treatment plan.

Nutrition and Vitamins After Weight Loss Surgery

Obesity is a chronic metabolic disease, and it disrupts nutrient handling long before surgery enters the conversation. Insulin resistance, chronic low-grade inflammation, altered gut hormones, and environmental exposures all change how nutrients are absorbed and used. Which is why so many patients arrive at a bariatric evaluation already deficient. Iron, vitamin D, B12, and folate are the gaps that show up most often on pre-op screening.

That baseline matters, because surgery does more than shrink the stomach or limit intake. It rewires physiology in ways that improve metabolism and open the door to new deficiencies at the same time.

Take Roux-en-Y gastric bypass. Skipping the proximal small intestine reduces absorption of iron, calcium, and several vitamins. Sleeve gastrectomy cuts ghrelin, the hunger hormone, and also changes how bile acids and gut microbiota handle nutrients. Across procedures, GLP-1 and PYY rise, boosting satiety and improving glucose metabolism, while also setting up the risk of postprandial hypoglycemia down the line. The same shifts that explain the weight loss explain why monitoring isn’t optional.

The nutritional risks are substantial. The 2019 multisociety perioperative guideline, cosponsored by AACE, The Obesity Society, ASMBS, the Obesity Medicine Association, and the American Society of Anesthesiologists, lays out 85 recommendations covering exactly this territory (Mechanick et al., 2019). Vitamin D and calcium deficiency approach universality without supplementation. Thiamine deficiency is easy to miss and clinically urgent when it appears. Iron, folate, zinc, and copper run low frequently, particularly after bypass and biliopancreatic diversion.

Protein deserves its own attention. Guidelines recommend 60 to 100 g/day, and real-world intake falls short of that repeatedly. A systematic review found protein intake below 60 g/day in the majority of studies examined, alongside significant lean mass loss (Ito et al., Obes Surg, 2017). That is the road to sarcopenia after weight loss, which undercuts the metabolic gains the surgery was supposed to deliver. Supplementation trials have tested doses in the 15 to 30 g/day range with mixed results, and a systematic review of the whole literature concluded the evidence for lean body mass preservation remains inconclusive (Nuijten et al., Nutr J, 2021). Worth saying plainly rather than overselling the shake.

For clinicians the plan is simple and demands discipline. Protein first. Multivitamins, calcium citrate with vitamin D, B12, and iron are required rather than suggested. Folate belongs in the plan, particularly for menstruating women and anyone with pre-op anemia. Transdermal patches are emerging for patients who can’t tolerate or adhere to oral supplements, though long-term data are thin.

Follow-up is more than labs. Education, repeated counseling, and multidisciplinary care are what make the difference. Dietitians, endocrinologists, and surgeons all have a role. Telehealth has opened real doors here, and models mixing remote contact with targeted in-person visits appear to improve long-term adherence. Prescriptions alone don’t carry patients through this. Structured support does.

One complication turning up more often is post-bariatric hypoglycemia, especially after Roux-en-Y. These patients present with symptomatic drops in blood sugar after meals, sometimes years out from surgery, driven by exaggerated GLP-1 and insulin secretion. Management usually comes down to lowering dietary glycemic load, cutting concentrated sugars, and spreading carbohydrate evenly through the day. Recognizing it early matters, because it gets misattributed constantly when nobody is thinking about it.

The larger point: bariatric surgery is a powerful intervention and it isn’t a cure. The operation is one part of it. Lifelong nutritional surveillance and metabolic management are the other. Prioritize protein, close the micronutrient gaps, keep follow-up consistent, and outcomes are both safer and more durable.

Scott Rennie, D.O.

References:

1. Mechanick JI, et al. Clinical Practice Guidelines for the Perioperative Nutrition, Metabolic, and Nonsurgical Support of Patients Undergoing Bariatric Procedures: 2019 Update. Endocr Pract. 2019;25(12):1346-1359. Cosponsored by AACE/ACE, TOS, ASMBS, OMA, and ASA. https://pubmed.ncbi.nlm.nih.gov/31682518/

2. Parrott J, et al. American Society for Metabolic and Bariatric Surgery Integrated Health Nutritional Guidelines for the Surgical Weight Loss Patient 2016 Update: Micronutrients. Surg Obes Relat Dis. 2017;13(5):727-741. https://pubmed.ncbi.nlm.nih.gov/28392254/

3. Ito MK, et al. Effect of Protein Intake on the Protein Status and Lean Mass of Post-Bariatric Surgery Patients: a Systematic Review. Obes Surg. 2017;27(2):502-512. https://pubmed.ncbi.nlm.nih.gov/27844254/

4. Nuijten MAH, et al. The effect of additional protein on lean body mass preservation in post-bariatric surgery patients: a systematic review. Nutr J. 2021;20(1):27. https://pubmed.ncbi.nlm.nih.gov/33750392/

Board Certified in Obesity Medicine and Family Medicine

This blog is for educational purposes only and does not constitute individual medical advice. Always consult your own physician before making changes to your health, medications, or treatment plan.